When you advance to a leadership position in any organization, you’d be expected to review financial statements and contribute to strategic discussions and decision-making. So, you need foundational knowledge about these reports. This article covers the key financial reports; balance sheet, Income and cash flow statement and associated terms like EBITDA, CAPEX and financial ratios.
What are Financial Statements:
These reports summarize an organization’s financial and accounting information, showing its financial performance during a specific accounting period.
The three main reports included in financial statements are:
- Balance Sheet
- Income Statement
- Statement of Cash Flows
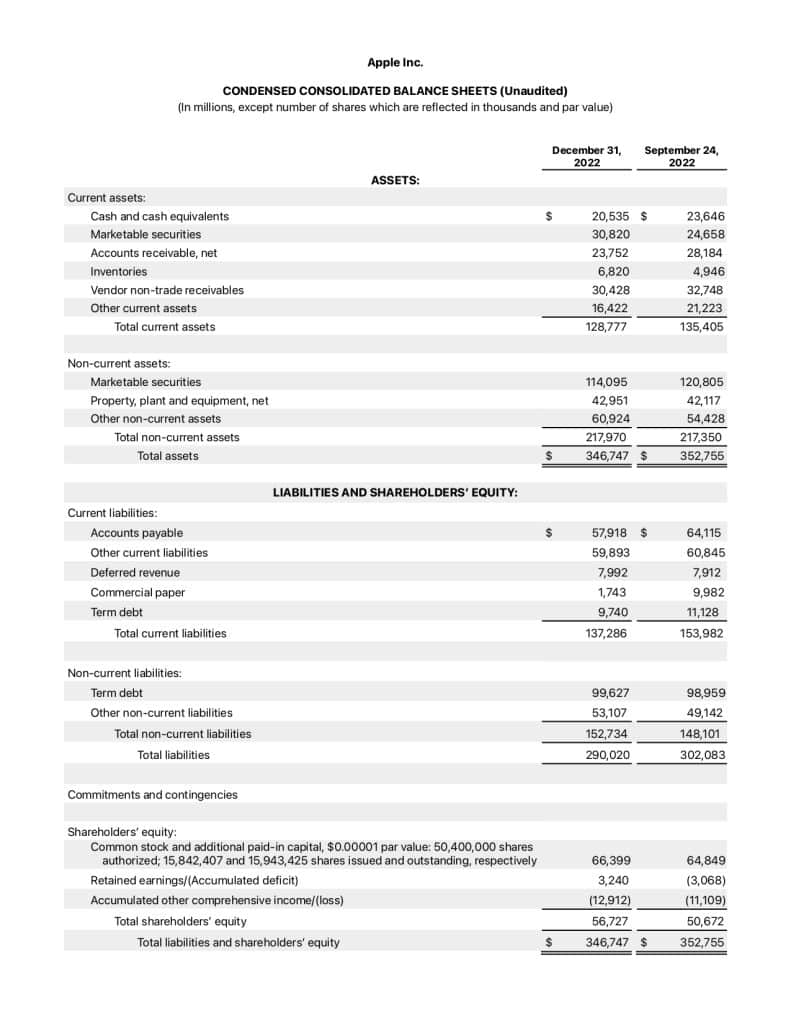
Balance Sheet:
The balance sheet has three main sections: Assets, liabilities, and equity.
Assets:
Resources with future economic benefits owned or within the control of a business are known as assets. They include cash, inventory, equipment, and trademarks. They are usually classified into two broad categories:
- Current Assets
- Non-current Assets
Current Assets:
These assets are expected to be converted to cash or utilized within one year. These include cash, accounts receivable, and inventory. Account receivables are money owed to a company by its customers for goods delivered or services rendered.
Non-Current Assets:
Assets that are expected to provide economic benefit, beyond one year. These include property, plant, patents, and equipment.
Liabilities
Liabilities are the debts that a company owes, such as bank loans, credit card debt, and accounts payable which are payments owed to suppliers. In short, any obligation that will result in giving up future economic benefits to other entities or businesses.
There are two kinds of liabilities
- Current liabilities: Debts payable within 12 months. For example, accounts payable, principal and interest on a bank loan, wages, income taxes payable
- Long-term liabilities: Payable beyond 12 months.
Equity
This represents your ownership in the business after subtracting what you owe others. It’s also the amount the owner or shareholders would receive if the business paid off all its debt and liquidated all its assets.
Accounting Equation
The “accounting equation” shows the relationship between a company’s assets, liabilities, and equity. According to this principle, the total value of a company’s assets is always equal to the sum of its liabilities and equity. Assets = liabilities + Equity.
So, based on this equation, we can derive others. Liabilities = Assets – Equity and Equity = Assets – Liabilites.
Financial Ratios
Financial ratios are computed from financial statements like the balance sheet and offer financial insights for decision-making. Let’s review some of these ratios.
Liquidity Ratios
Liquidity is the company’s ability to convert assets to cash to meet short-term obligations. Cash is a liquid asset because it’s already in the form of money. Similarly, accounts receivable is a liquid asset because it’s money you expect to collect soon from customers.
Liquidity ratios assess a company’s ability to settle short and long-term debts. These include:
- Current Ratio
- The Acid-test Ratio
- Cash Ratio
Current Ratio
Formula: Current Assets / Current Liabilities
This ratio measures a company’s ability to repay short-term obligations using current assets. A value above 1 indicates that the company has more current assets than current liabilities.
Let’s say the amount of current liabilities a company has far exceeds its current assets, this could be a sign that meeting upcoming obligations might be difficult. With this insight, you can focus on collecting receivables faster.
The Acid-Test Ratio
Formula: (Current Assets – Inventory) / Current Liabilities
The Acid-test ratio is a more restrictive liquidity ratio compared to the current ratio since it excludes inventory from current assets. It shows whether a company can service debts without relying on the sale of inventory.
Cash Ratio
Formula: Cash and Cash Equivalents / Current Liabilities
The cash ratio measures a company’s ability to handle current liabilities with cash and cash equivalents.
Leverage Financial Ratios
Financial leverage is using borrowed funds to finance asset acquisition or investments, to amplify returns.
Let’s review a few of these leverage ratios
- Debt Ratio
- Debt to Equity Ratio.
- Equity Ratio
Debt-to-Equity Ratio
Formula: Total Liabilities / Total Equity
This measures the proportion of debt relative to the owner’s equity and a higher ratio indicates more leverage.
Debt Ratio
Formula: Total Liabilities / Total Assets
This measures the proportion of debt relative to assets.
Equity Ratio
Formula: Total Equity / Total Assets
This ratio shows the percentage of the company’s assets financed by the shareholder’s equity. It is an indicator of how leveraged a company is. Values of .50 or below are considered leveraged while ratios above .50 are considered conservative.
How to Review a Balance Sheet
We covered the main components of a balance sheet: assets, liabilities, and equity. We also highlighted some financial ratios that can be used when analyzing the report. However, here are some general tips.
Review current and Long-term assets
- Check if the company has enough cash to meet short-term needs such as salaries, vendor payments, or any loans and interests.
- Check for any significant increase in the accounts receivable from the previous accounting period, which might signify that collections are slow.
- You can also compare inventory levels between two periods which might point to overstocking or slow sales.
- Compare the total assets year over year to assess the company’s growth and examine what makes up the company’s assets. Is it just cash and cash equivalents or is the company acquiring long-term assets?
Examine Liabilities
- Check for an increase in accounts payable from the previous year, and ask questions regarding the timeliness of vendor payments.
- Check whether liabilities are increasing over time and whether their growth is rapid.
Examine Equity
- Dividends. How much is paid out to stakeholders versus what is retained for growth?
Income Statement
An income statement, which is also called the profit and loss statement or “P&L” shows a company’s earnings, expenses, profits, and losses for a given period.
The following sections will typically appear in a P & L statement:
- Revenue
- Cost of goods sold
- Gross profit
- Operating expenses
- Operating Income (operating profit)
- Earnings before Tax
- Taxes
- Net Income
Revenue:
This is the company’s sales (earnings from selling the company’s products or services). Although a higher revenue means the company sold more products, it is not an indicator of profitability.
Cost of Good Sold (COGS)
The costs incurred to produce a product for sale. This includes direct labour costs and materials. COGS is usually reported by companies that produce goods. A related term is the cost of sales which is more applicable to wholesalers and retailers. It is costs such as shipping and duty payments directly incurred in acquiring goods for resale.
Gross Profit
Subtracting the cost of goods sold from the total revenue gives the gross profit. It represents money left after covering direct production expenses but before deducting operational costs.
Operating Expenses
This includes administrative and general expenses incurred by the business such as rent, utilities, and marketing costs. It can also include salaries and wages not directly related to production.
S,G & A stands for “Selling, General and Administrative expenses” and includes wages, utilities, rent, marketing and other overhead expenses.
Operating Income (Operating Profit)
The operating income or profit is determined by subtracting the operating expenses from the gross profit
Earnings Before Tax (EBT)
After considering operating and non-operating income and expenses, you arrive at Earnings Before Tax, which represents the profit before taxes are deducted.
What’s the Difference between Operating Income and EBIT
According to Corporatefinanceinstitute.com, both terms are the same.
Taxes:
Taxes owed by the company.
Net Income
This is the final profit after deducting all expenses, including taxes, from total revenue.
Other Terms Used in Income Statements
You might come across additional terms in an income statement:
- Amortization
- Depreciation.
- EBITDA
- EBIT
Amortization
Amortization is an accounting technique for spreading the cost of long-term assets over their expected useful life. When an amortization expense appears in the income statement, the asset value is reduced by the same amount in the balance sheet. It is not a cash expense.
Depreciation
Depreciation represents the estimated decrease in the value of a fixed asset during a fiscal year. The depreciation expense, as recorded in the income statement, reduces the value of the long-term asset in the balance sheet. Additionally, it does not represent a cash outflow.
EBITDA
EBITDA is the acronym for earnings before interest, taxes, depreciation & amortization.
Formula: Net profit + interest + income tax + depreciation and amortization.
Interests on accounts receivable are excluded from this calculation.
EBIT
Earnings before interests and tax.
EBIT= EBT + Interest
Reviewing a P & L Statement
- Compare gross profit margins to industry standards or expectations. The gross margin is calculated by dividing the gross profit by the revenue. Gross Profit / Revenue
- Examine operational expenses. Operational expenses should be fairly predictable from year to year. Rising operational expenses need to be justified. High operating expenses could also be a sign of inefficiencies.
- Operating income margin. Compare the operating income margin to previous accounting periods. The operating income margin is determined by dividing the operating income by revenue. That is, Operating income / Revenue.
- Similarly, check the net profit margin and compare it with industry standards.
- Check for taxes. Are you paying more taxes than required?
- Bottom line, you are assessing that revenue is growing while expenses are stable and low, and net income is improving
![]()
Statement of Cash Flows
This is also called the cash flow statement and it shows cash generated and spent during an accounting period. It has three sections:
- Operating activities
- Investing activities
- Financing activities
Operating Cash Flow:
Shows cash flow associated with operations. It will contain the net income from the P & L.
Depreciation and amortization are also included because they lower the net income but are not actual cash flows. You’d also see cash from accounts receivable, accounts payable and inventory.
Investing Activities
Includes cash flows associated with non-current assets such as property, plant and equipment. This section could contain a CAPEX (Capital Expenditure) entry
Financing Activities
Includes cash flows related to borrowing and repaying bank loans, issuing and repurchasing shares, and issuing bonds.
The net cash flow from all three sections is added to the beginning cash balance to arrive at the ending cash balance, which matches the cash on the Balance Sheet. A positive net cash flow shows that the company is generating more cash than it is spending.
Additional Resources
Image credits: Balance Sheet, Cash Flow Statement, Statement of Operations. Apple.com