The “BCG Matrix” was authored by Bruce Henderson in 1970. It explores product classifications based on market share and product growth. I’ll bring down the key concepts in the original article and review some applications and possible gaps as they relate to the business world today.
For a company to succeed, it should have a portfolio of products with various growth rates and market shares.
Growth Rate:
Growth Rate refers to the percentage increase or decrease in an organization’s sales, revenue, or other key performance indicators over a given period.
Here’s the general formula for calculating Growth Rate:
Growth Rate: (Present value – Past value) X 100
Past Value
Where:
Past Value is the metric’s value in the past (for example, revenue from the previous year).
Present Value is the metric’s value in the current or most recent period (for example, revenue for this year).
It’s worth noting that organizations can calculate growth rates for different periods, such as quarterly or annually, based on their reporting requirements. Growth Rate can also be estimated for other key performance indicators outside revenue, depending on the company’s objectives.
Market Share:
A company’s market share represents its contribution to the overall market revenue. It is presented as a percentage and indicates a company’s relative size in a given industry or market.
Since it’s a percentage of the total market revenue, it’s calculated by applying the following formula:
Company’s revenue X 100
Total Market Revenue
The total market revenue is usually estimated. For example, by relying on industry reports or published government data on market size and sales within a specific period.
Bruce Henderson | Rules of Cashflow
According to Bruce Henderson, a product’s cash flow is driven by 4 rules:
Market share determines margins and cash generated. High margins are correlated with a large market share.
Let’s review some factors that may be responsible for this observation
Economies of Scale
As a company gains a larger market share, it usually benefits from economies of scale. This means that the cost per unit of production falls due to production efficiency.
Brand Power
Companies with a large market share typically have high brand recognition and consumer loyalty.
Bargaining Power with Suppliers
These companies typically have more bargaining power with suppliers which can lead to better payment terms, discounts, or other favourable business arrangements, which could contribute to better margins for the company.
Growth requires an injection of cash to finance additional assets. The additional capital required to hold shares varies with growth rates.
High market share must be earned or purchased. Purchasing market share needs further investment.
Business Expansion
Growth usually involves capital investment to expand production or acquire other capital assets. For example, a company might purchase trucks or build a warehouse to improve distribution to certain geographical areas.
Sales and Marketing
The company might need to invest in marketing and sales to retain customers. This could include more advertising, promotions, or increasing its sales force, all of which require cash outflows.
No product market can grow indefinitely. The payback from growth must occur when growth slows, or it will never happen.
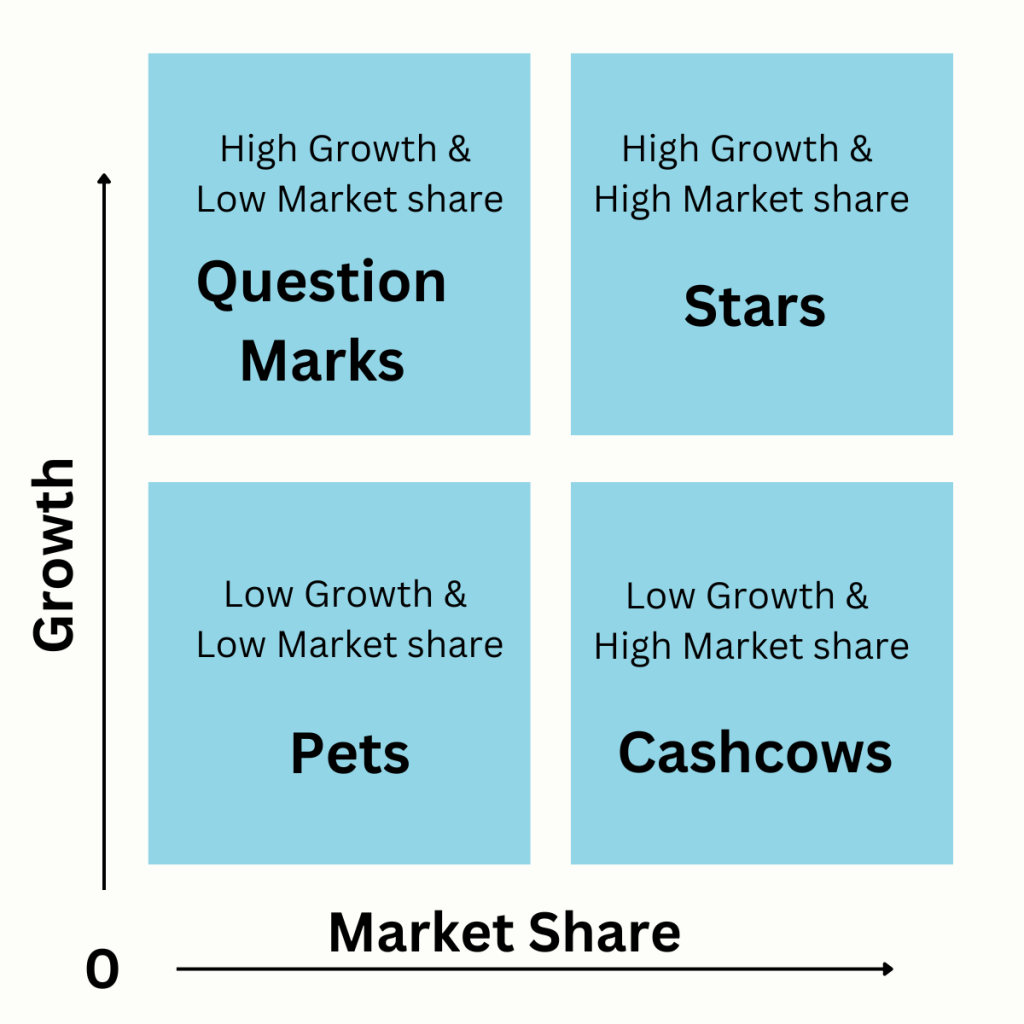
Product Classification | BCG Matrix
 Cash Cows
Products with a large market share but slow growth are known as “cash cows.” Typically, they create significant sums of cash that exceed the reinvestment required to maintain market share. According to Henderson, “this excess does not need to, nor should it be, reinvested in the same business unit.
Cash cows typically have excess resources, which can be used to support other products that need additional resources.
Pets
Products with a low market share and slow growth are considered “pets.” They may show an accounting profit, but the profit must be reinvested to keep the share, leaving no cash throwoff. The key difference between a cash cow and a pet is that the former produces a return on investment (ROI) that far exceeds its growth rate (which means there’s surplus cash that can be channelled to other projects), the latter generates an ROI closer to its growth rate which means you’d need a continuous cash influx to maintain whatever ROI the product generates.
Question Marks
The “question marks” are products with a low market share but a high growth rate. They usually require significantly more money than they can earn. If cash is not available, they will fall behind and die. The question marks indicate that a significant further cash investment is required to purchase market share. Unless it becomes a leader, the product’s low market share and strong growth rate will be a problem.
Stars
A “star” is a product with a high share and growth rate. Stars operate in markets that are rapidly growing which means that there’s also a growing demand for the product or service. As the market matures, their growth rate may drop, but their large market share might result in substantial profits. In this way, stars have the potential to become cash cows in the future if their market share remains or grows.
What Businesses Can Learn from The BCG Matrix
Portfolio Analysis and Diversification
It’s a way of assessing a company’s product portfolio. That is, it can help business owners understand which products are driving company growth and which ones aren’t.
Resource Allocation/ Strategic planning
The expectation is that when new products are launched, they might not be stars. They might be “question marks” which require huge capital investments to become market leaders. So, the company can channel resources to support the growth of “question mark” products
Cashflow Management
Henderson recommends that cash flows from Cashcows to Question marks. Why? Cash cows produce excess cash which doesn’t need to be reinvested. A cash cow is a mature product and market leader. Stars however need that cash reinvested so they too can become cash cows.
Shortfalls to the BCG Matrix
Although I believe the BCG Matrix is a good tool, it might have some limitations. Let’s explore some.
It’s a Simplistic View
It’s possible that some products will not fit perfectly into these categories for various reasons including the nature of business. For example, could we apply the BCG matrix to a fast fashion company like SHEIN?
No Consideration For Market Forces
This point is arguable, in that, maybe the tool was designed to examine growth rate and market share, but it doesn’t provide any guidance on managing competition or changes in consumer behaviour. If this tool is going to be used for strategic planning or cash flow management, future changes in market dynamics need to be examined.
No Consideration for External Factors
The main question is, how long can you rely on a cash cow? External factors, such as changes in regulatory environments, economic conditions, or technological disruptions, are not taken into account and these factors can significantly impact any product, including cash cows.
BCG Matrix – Frequently Asked Questions
What does the market growth rate refer to, as used in the BCG matrix?
Growth Rate refers to the percentage increase or decrease in an organization’s sales, revenue, or other key performance indicators over a given period.
Which of the following refers to a cash cow?
- a product with a long-term future.
- a product with low growth and a low market share.
- a product with high growth and a high market share.
- a product with high growth and a low market share.
- a product with low growth and a high market share.
The right answer is option 5. A product with a low growth and a high market share
According to the BCG matrix, which type of product typically has excess resources, which can be used to support other products that need additional resources? The right answer is Cash cow.
According to the BCG matrix, what defines a cash cow? The cash cow has three distinct characteristics:
- High market share.
- Low growth rate
- Excess resource generation
According to the BCG matrix, what should a company do with the cash that is generated by cash cows?
The excess cash should be used to develop other products that require additional resources such as Stars or question marks.
Reference:
The Product Portfolio; Bruce Henderson, 1970. https://www.bcg.com/publications/1970/strategy-the-product-portfolio