What is a Gantt Chart?
A Gantt chart is a bar chart that visualizes project tasks along a timeline. Each bar represents a task, showing its start and end dates. Additional elements, such as dependencies, milestones, and task progress, can provide further insights into a project’s workflow.
When to Use a Gantt Chart
Gantt charts are not always necessary, so understanding when to leverage them can make your project management more effective. For example, they are useful when presenting a clear and professional overview of a project timeline to clients or stakeholders. They are also useful in traditional/waterfall projects with phases and milestones because they can help visualize the transition between stages and ensure nothing is overlooked. However, for projects in highly dynamic environments where tasks and priorities change frequently, the rigidity of a Gantt chart can become a hindrance rather than a help. They are also useless if the project is simple with only a few tasks.
Tools for Creating Gantt Charts
Free Gantt Chart Makers
Gantt Chart in MS Excel
Creating a Gantt chart from scratch in Excel can be cumbersome. So, my recommendation is to customize any of the templates in the template gallery. You should use a template that automatically changes the bars in the Gantt chart as you edit the dates. Here’s how to find and customize a template.
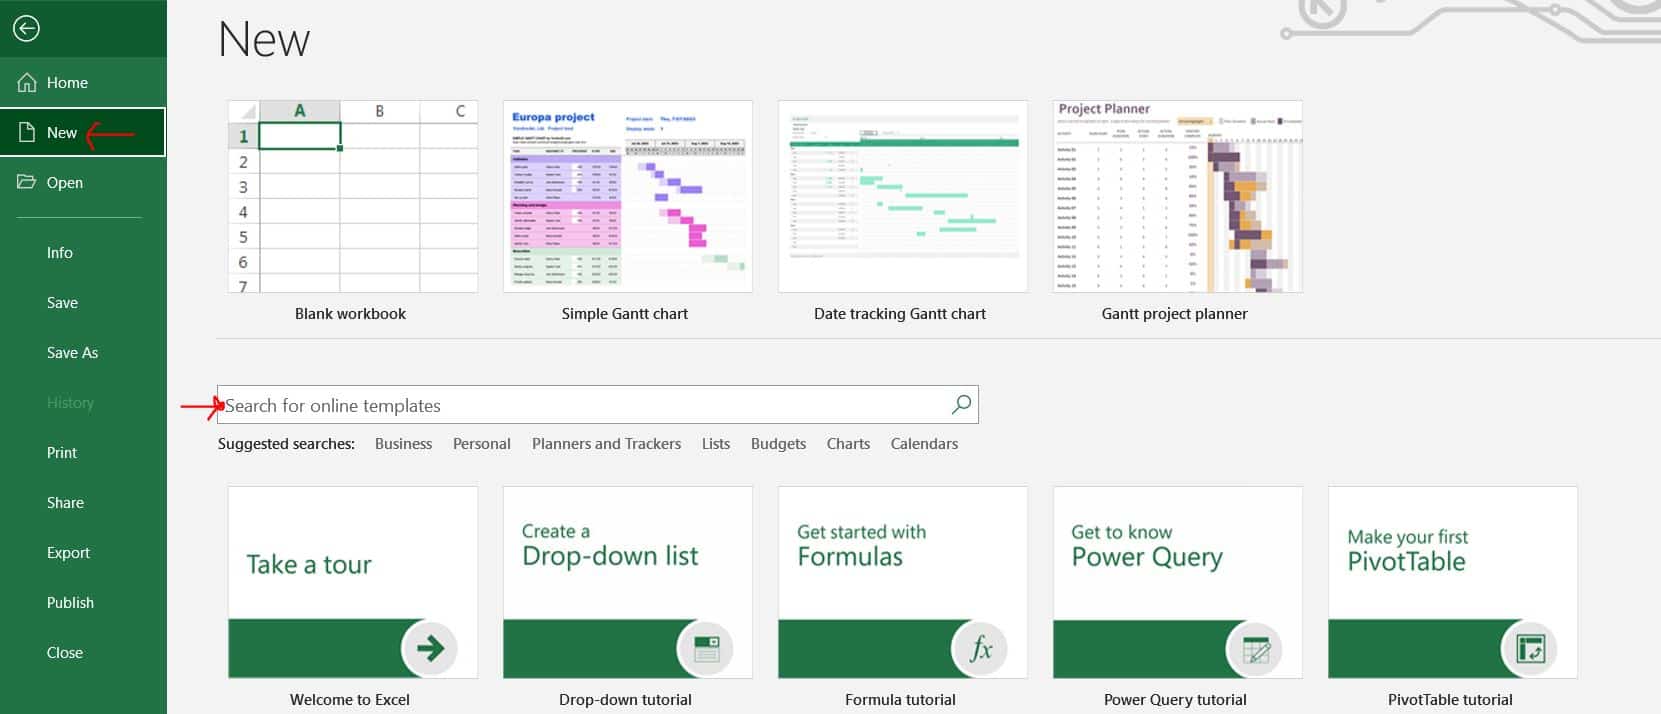
From your Excel application, click on File in the menu panel, then click on New,
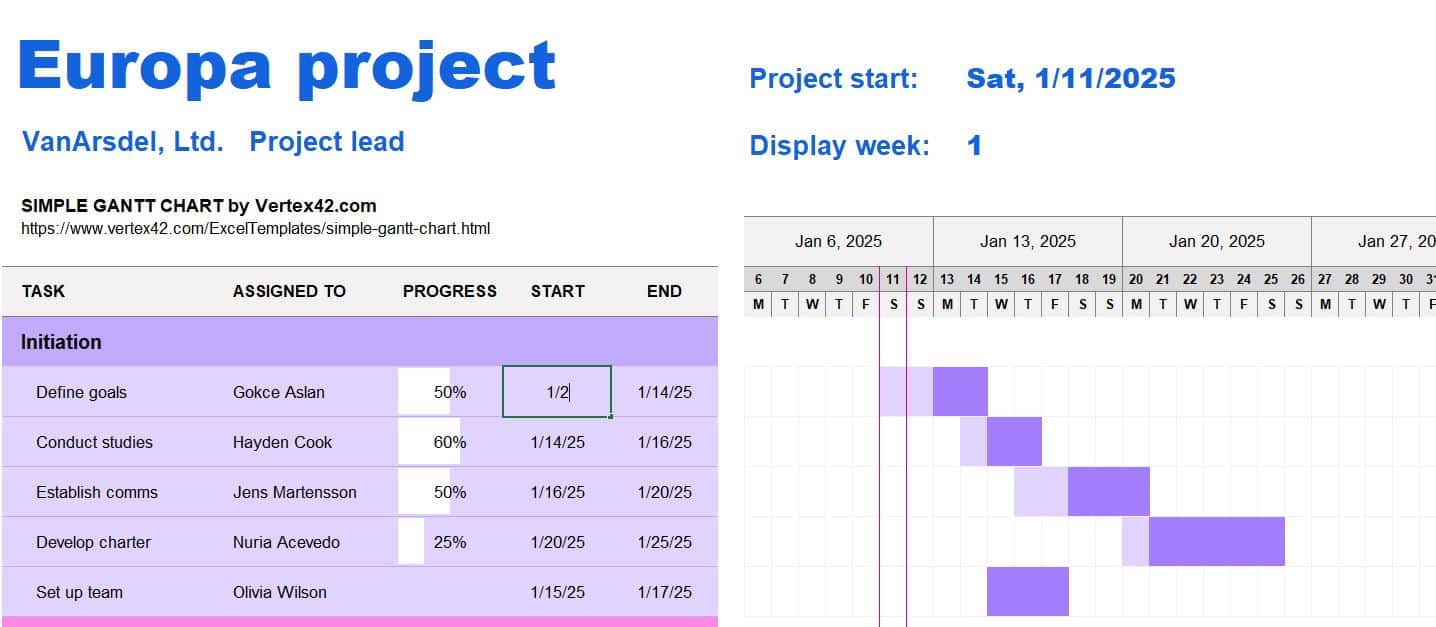
Type “Gantt” in the search bar, then choose from any of the Gantt chart templates in the gallery. I prefer this template created by www.vertex42.com. Select the template and start customizing. Again, creating and customizing Gantt charts in Excel and Google Sheets can be technical and time-consuming. However, if future projects are similar, then the template created can be reused, saving you time.


Project Management Tools (Asana, Click Up, SmartSheet)
Most project management tools have a Gantt chart view of your project, based on project tasks’ start and end dates. However, this feature is only available on the paid versions of most of these applications. However, Click Up’s Gantt chart view is available on the free version. Visit clickup.com to get started.
Limitations of Click Up Free Forever Plan
- While the Free Plan includes Gantt charts, advanced features like task dependencies and workload views are more limited compared to premium plans.
- 100 MB Storage: While sufficient for basic tasks, this limit can be restrictive for projects involving large files or media.
- Free users can create up to 1 Dashboard with 100 uses of widgets, limiting your ability to customize and visualize data for multiple projects.
- Only 100 automation runs per month are available on the Free Plan, making it less ideal for workflows that heavily rely on automation.
- Free users cannot access the goal-setting feature or track portfolios, which are useful for strategic project alignment.
- Advanced resource management and time tracking are not included.
- Comprehensive reporting tools, such as custom charts or advanced analytics, require a paid plan.
In terms of information security, ClickUp has achieved ISO 27001:2013, ISO 27017:2015, and ISO 27018:2019 certifications, demonstrating adherence to international information security standards. ClickUp also offers HIPAA compliance; however, this feature is not available on lower-tier plans.
OnlineGantt.com
OnlineGantt.com is a free, web-based Gantt chart tool designed to simplify project planning and scheduling. It requires no sign-up or downloads, allowing users to create and manage Gantt charts directly in their browser. The platform offers an intuitive interface, enabling users to quickly create and edit Gantt charts without a steep learning curve. Users can also define tasks, set durations, and establish dependencies to accurately reflect project timelines. Projects can be exported for offline access or sharing with stakeholders. While OnlineGantt.com offers essential features for Gantt chart creation, it may lack some advanced functionalities found in premium project management tools, such as resource allocation, real-time collaboration, and integration with other software platforms. Moreover, you’d need to verify information security and data compliance with your IT compliance team before using any online tool or software.
Paid Gantt Chart Makers
Monday.com
Renowned for its visual progress tracking, monday.com offers customizable Gantt charts that facilitate team project management. It provides a 14-day free trial and a free plan, with premium plans starting at $8 per user per month (billed annually).
Microsoft Project
Ideal for detailed project planning, Microsoft Project provides comprehensive Gantt chart capabilities. It integrates seamlessly with other Microsoft Office tools, with pricing available upon request.
Smartsheet
Smartsheet combines project management and collaboration features with Gantt chart functionality. It offers a 30-day free trial, with premium plans starting at $14 per user per month.
TeamGantt
TeamGantt is known for its user-friendly interface, allowing for easy project scheduling and management. It offers a free plan for up to three users and one project, with premium plans starting at $19 per month.
GanttPRO
GanttPRO specializes in Gantt chart creation with features for resource optimization. It offers a free trial, with premium plans starting at $15 per user per month.
Asana
Asana provides this functionality through its Timeline feature, suitable for large teams. It offers a free plan, with premium plans starting at $10.99 per user per month.
Olutobi
I write about business and project management.
10+ years working in program management. I've worked in health-tech, community health, regulatory affairs and quality assurance.


