Whether mapping a customer journey, documenting a standard operating procedure, or troubleshooting a bottleneck in a production line, a flow chart can make the complex feel manageable. This article explores the practical use cases of flow charts across various industries and functions—and how you can harness them to improve clarity, collaboration, and performance.
What Is a Flow Chart?
A flow chart is a visual diagram representing a process, workflow, or system. It uses standardized symbols—like rectangles for steps, diamonds for decisions, and arrows to indicate direction—to illustrate how a process flows from start to finish. The power of a flow chart lies in its simplicity: it turns abstract ideas and complex procedures into clear, visual narratives.
Process Mapping and Documentation
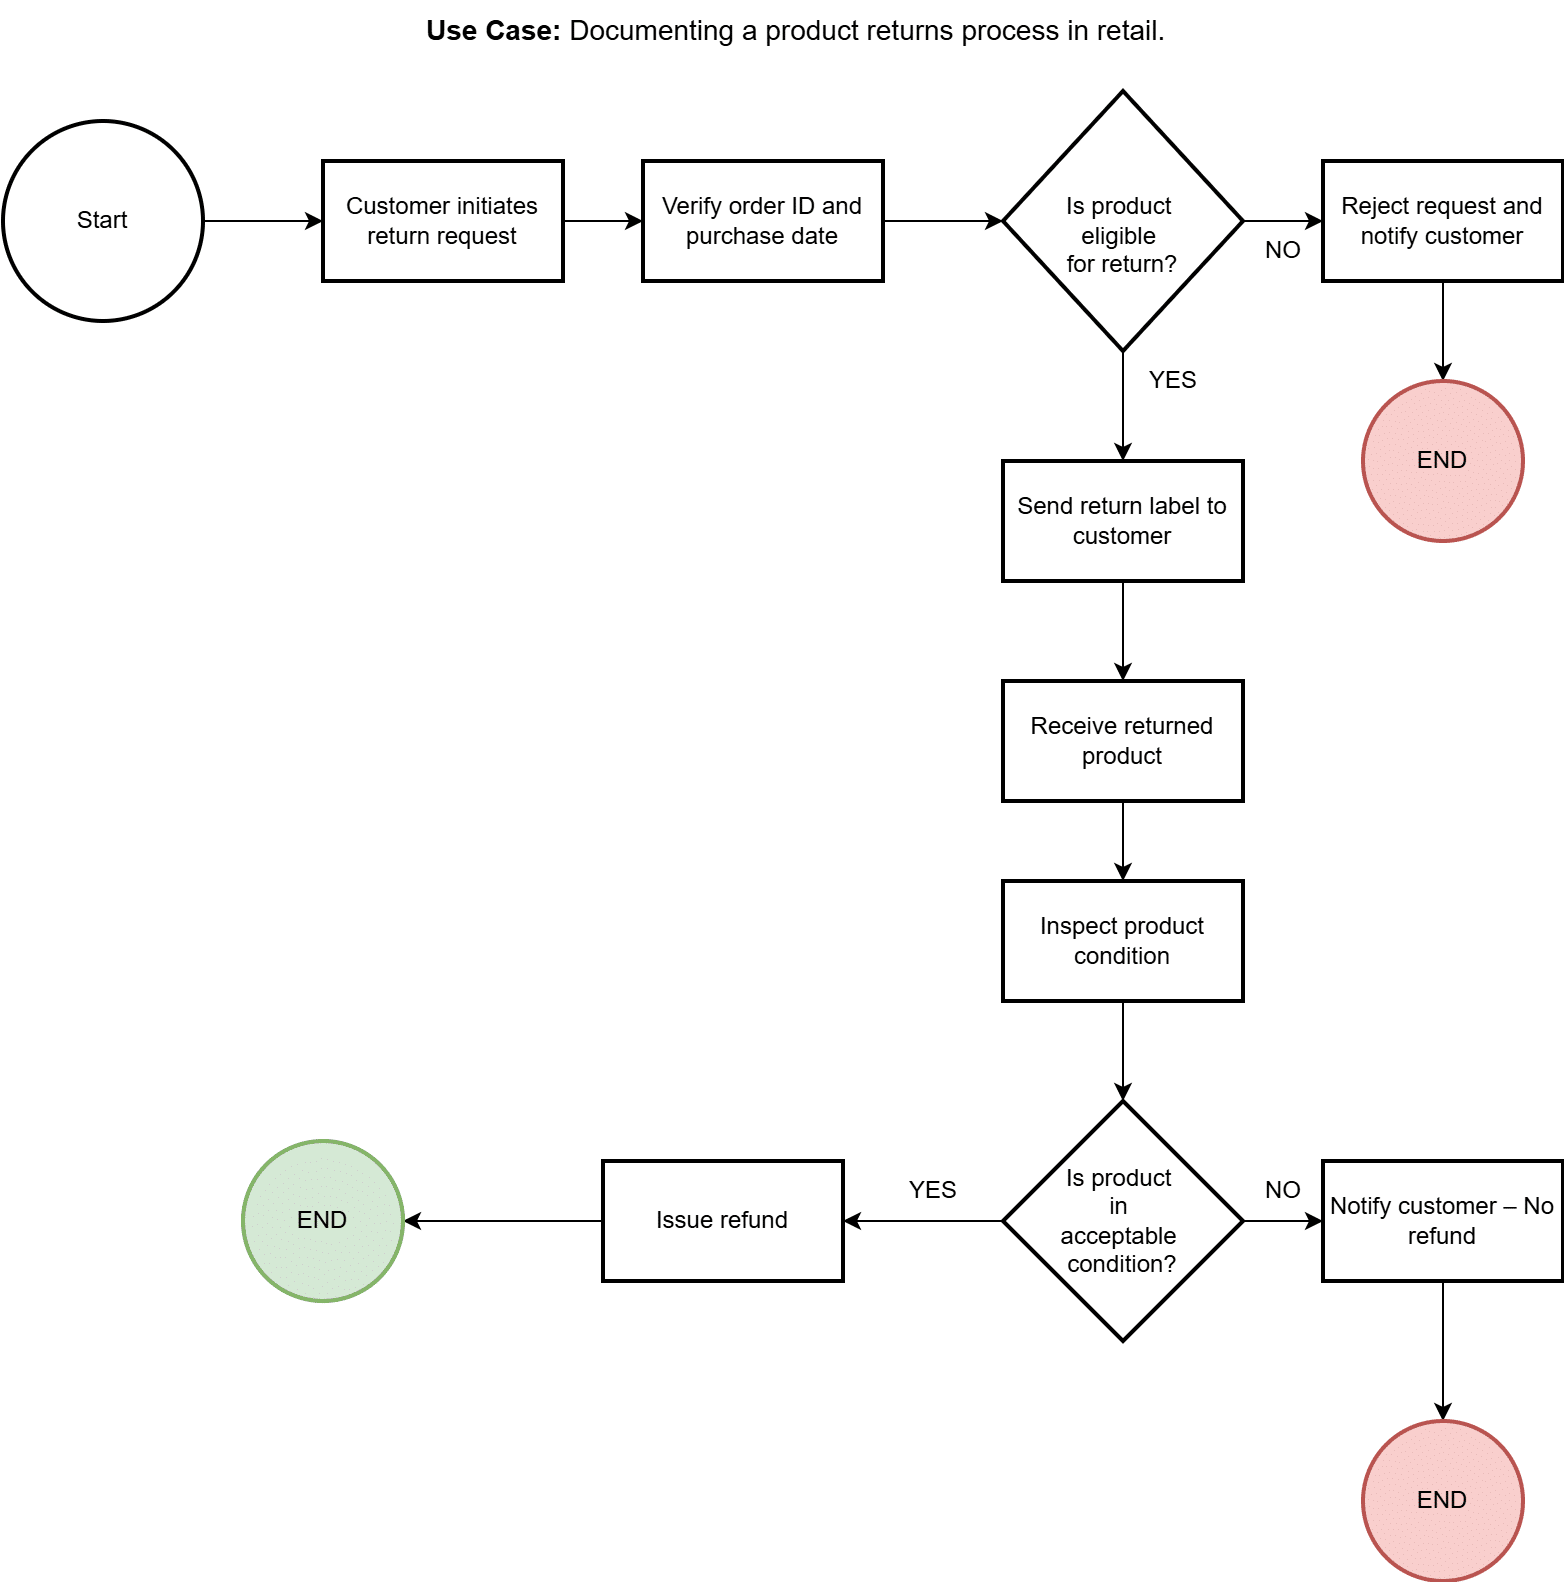
One of the most common uses of flow charts is mapping out processes for better understanding and documentation.
Sample Use Case: Documenting a product returns process in retail.
 Decision Making and Problem Solving
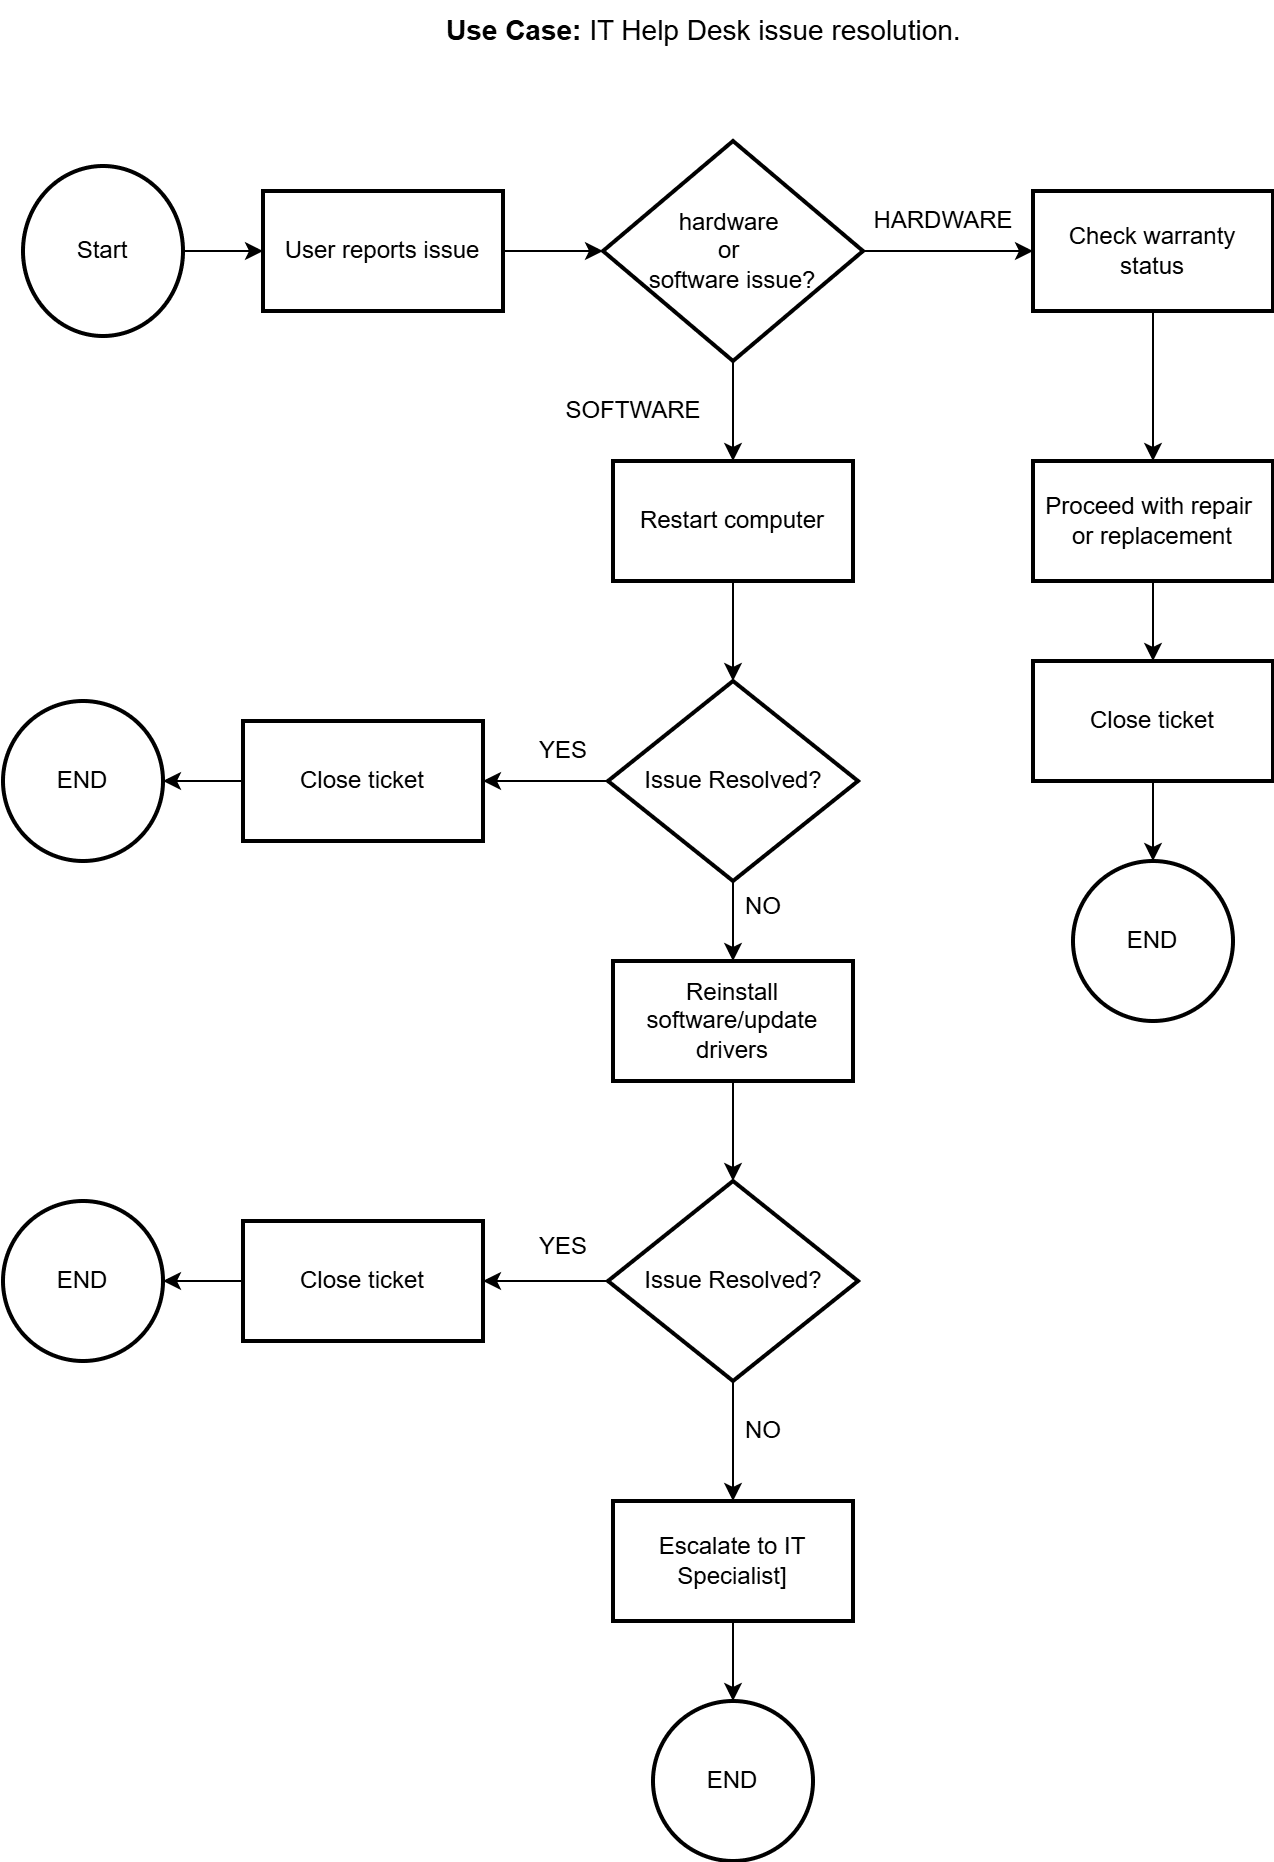
Flow charts can help teams visualize decision points and possible outcomes, making it easier to troubleshoot issues or make data-driven choices.
Use Case: An IT support team creates a decision tree to guide technicians through the steps of diagnosing and resolving technical issues, such as network errors or system crashes.
Why it matters: Structured decision-making improves speed and accuracy while reducing the risk of errors.
Project Planning and Workflow Design
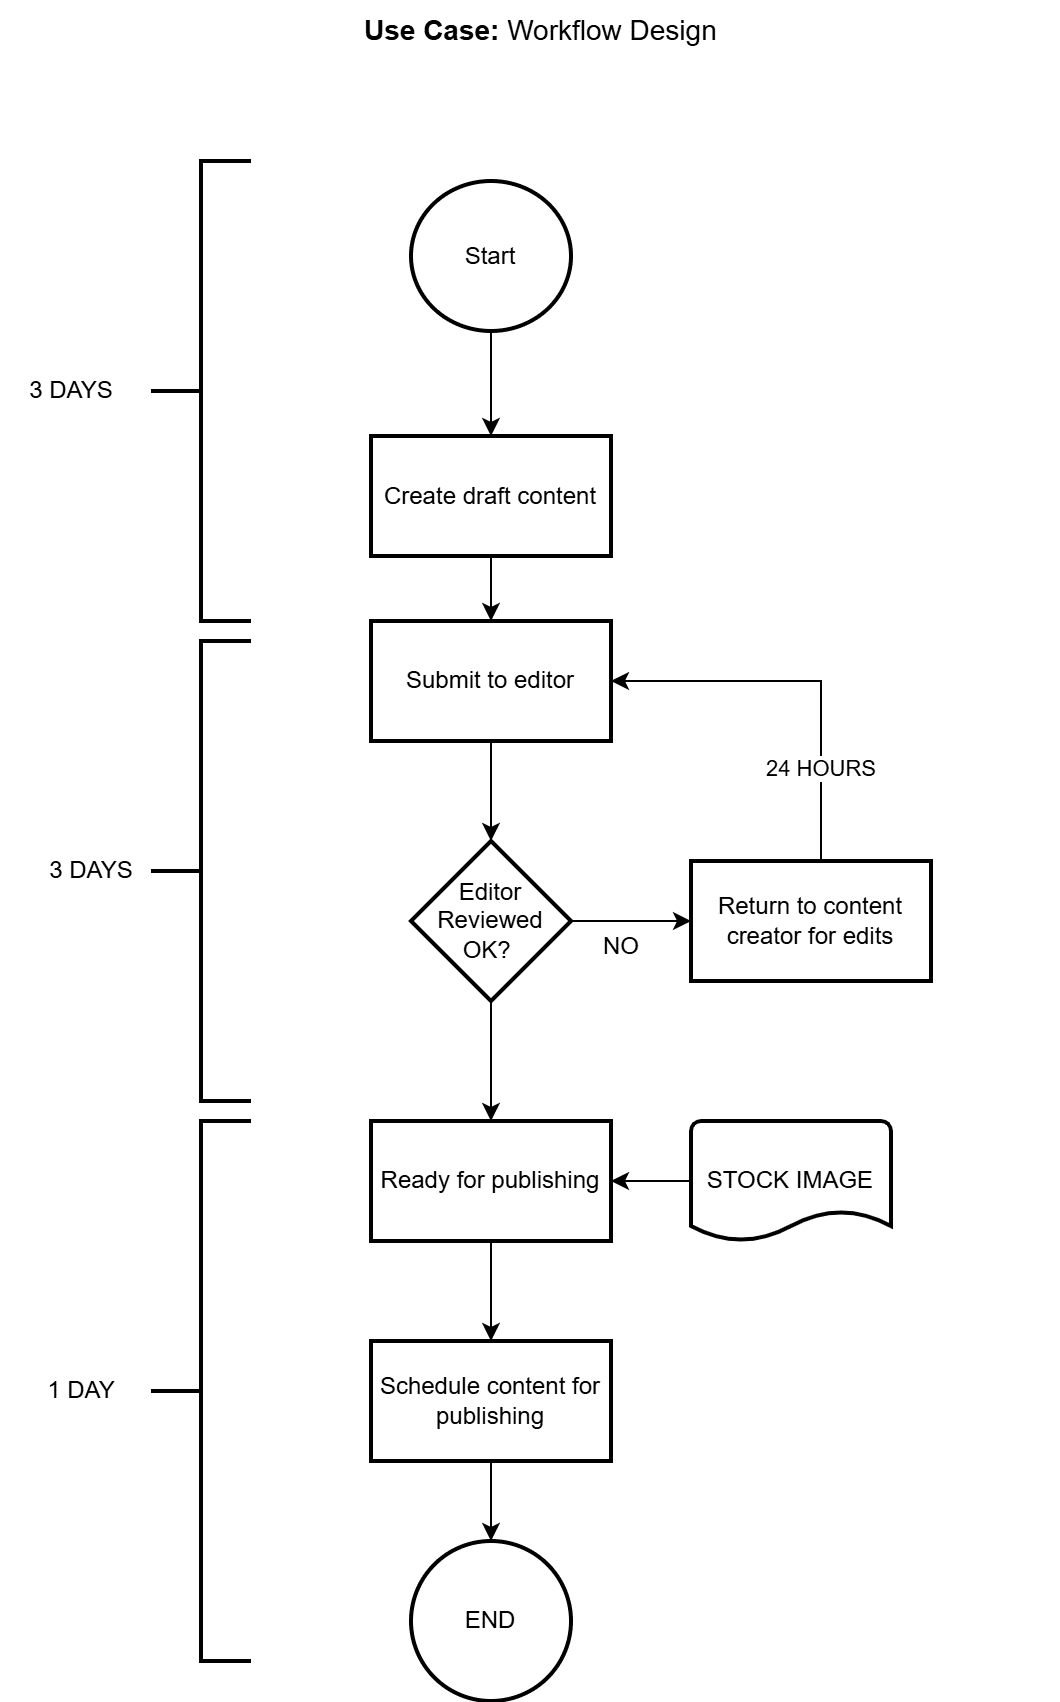
Flow charts help project managers outline project phases, dependencies, and key milestones. They’re also useful in designing repeatable workflows.
Use Case: A marketing team builds a flow chart to outline the content creation process—from ideation to publishing—highlighting approval steps, content formats, and collaboration points.
Customer Journey Mapping
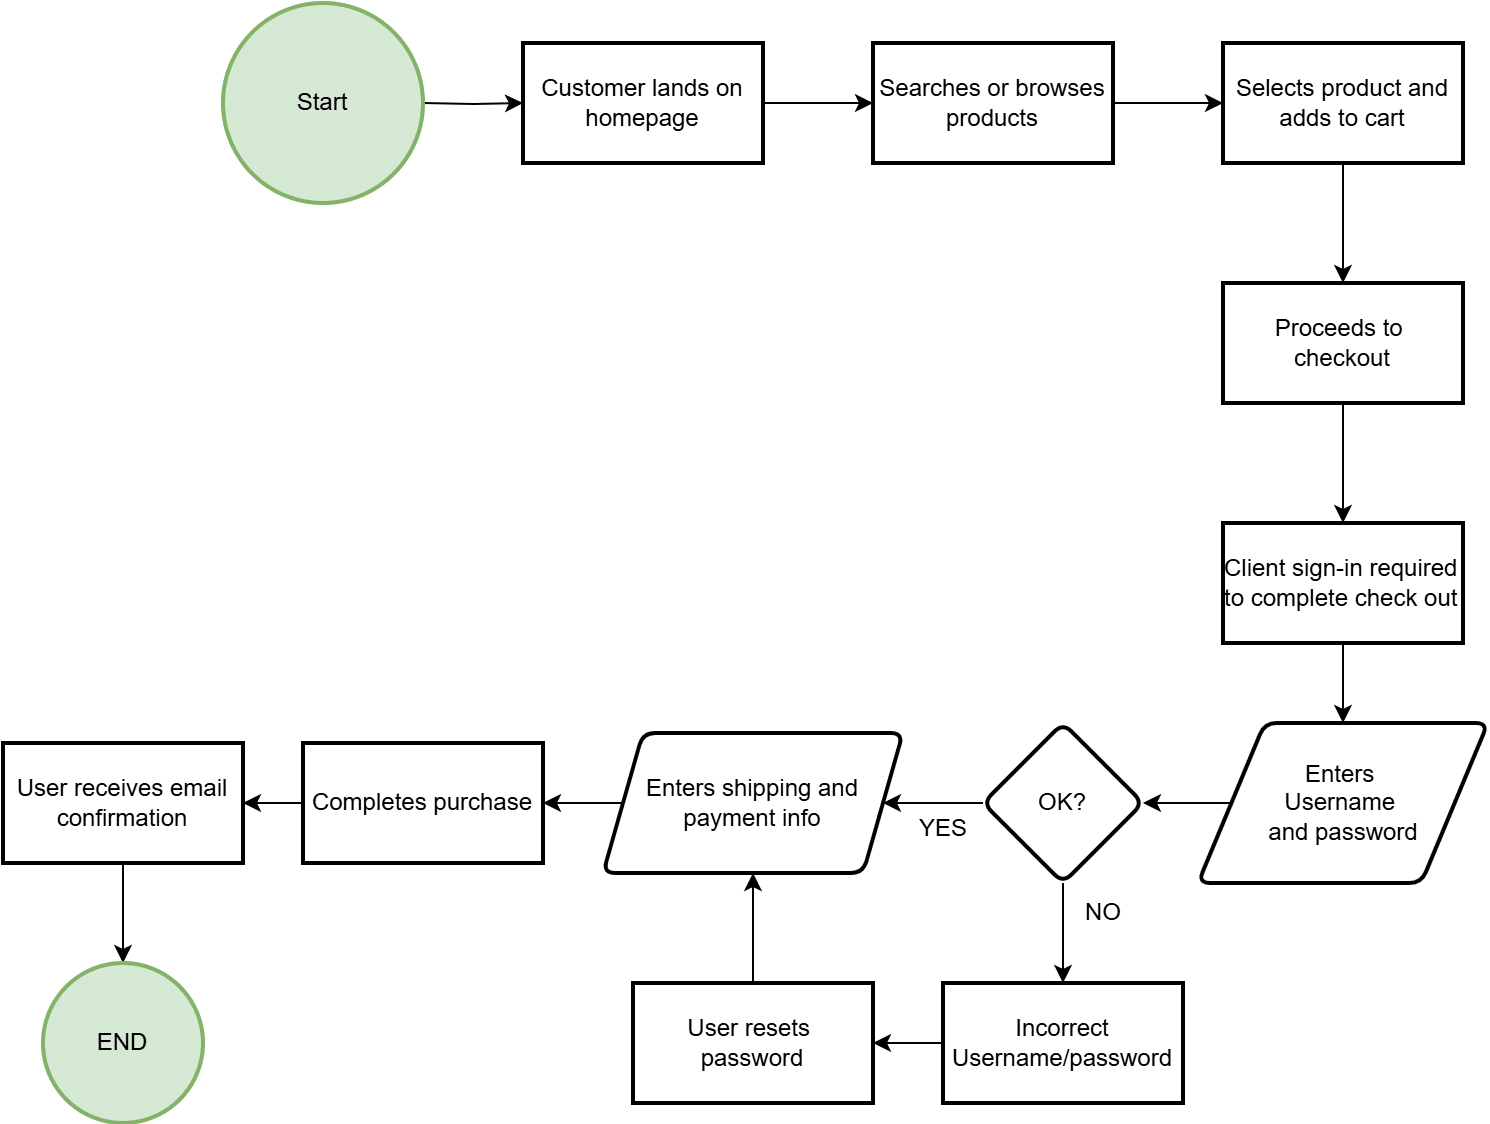
Understanding how customers interact with your business is key to improving their experience, and flow charts are an effective way to visualize that journey.
Use Case: An e-commerce brand maps the entire customer journey—from product discovery to post-purchase follow-up—identifying friction points and optimization opportunities.
Why it matters: It reveals insights into user behavior, enabling better design, marketing, and service decisions.
Software Development and System Design
In technical fields, flow charts visualise system architecture, coding logic, and feature workflows.
Use Case: A software development team uses flow charts to outline user flows and backend processes for a new mobile app, ensuring clarity before development begins.
Explaining Automation in Business Processes
Use Case: Visualizing an automated invoice approval workflow in an accounting system.
Flow charts are powerful tools for demonstrating how automation works behind the scenes. Whether you’re proposing an automation initiative to stakeholders or training teams on new workflows, a flow chart makes it easier to understand how manual steps are replaced or enhanced by automated logic.
Why it matters: Automation can feel abstract to non-technical audiences. Flow charts provide a visual way to show where automation fits into a process, what triggers it, and what outcomes it produces—reducing resistance to change and aligning stakeholders.
Common Mistakes When Creating Flowcharts
Flow charts are incredibly useful—but only when done right. Poorly constructed flow charts can cause more confusion than clarity, especially in cross-functional teams or process documentation.
Here are some of the most common problems or mistakes when creating flow charts—and how to avoid them:
1. Lack of Clear Start and End Points
Problem: Flow charts without clearly defined starting or ending points leave users wondering where the process begins or what the final outcome should be.
Fix: Always include a Start and End node using consistent shapes (typically ovals). This anchors the flow and gives it direction.
2. Too Much Detail (Overcomplicating the Chart)
Problem: Trying to include every possible exception, variation, or sub-process can lead to cluttered, unreadable charts.
Fix: Keep it high-level, especially for communication and training purposes. For more complex processes, break them into multiple sub-flow charts or use swimlanes to separate responsibilities.
3. Inconsistent Use of Symbols
Problem: Using non-standard or mixed shapes (e.g., a rectangle for a decision point or a circle for a process step) confuses users, especially if they’re unfamiliar with flow chart conventions.
Fix: Stick to standardized symbols:
- Ovals for Start/End
- Rectangles for process steps
- Diamonds for decision points
- Arrows to show flow direction
Add a legend or key if needed.
4. Poor Flow Direction
Problem: Arrows pointing in multiple directions (left, up, back, diagonally) make it difficult to follow the logic, especially in large charts.
Fix: Design your chart to flow top-to-bottom or left-to-right consistently. Avoid backward arrows unless absolutely necessary.
5. Missing or Misleading Decision Logic
Problem: Decision points (diamonds) without clear Yes/No (or True/False) labels lead to ambiguity about what the next step should be.
Fix: Always label decision branches clearly so users can follow each logical path.
6. No Defined Roles or Ownership
Problem: It’s unclear who is responsible for which step in team environments, especially in cross-functional workflows.
Fix: Use swimlane diagrams to assign process steps to different roles, departments, or systems. This increases accountability and facilitates collaboration.
7. Overuse of Arrows or Connectors
Problem: Too many crisscrossing lines or connectors make the chart look tangled and hard to follow.
Fix: Use consistent spacing and alignment. If needed, break a large chart into logical sections or simplify complex branches.
8. Failing to Review or Test the Logic
Problem: A flow chart that looks good visually may still contain logical gaps, dead ends, or missing steps.
Fix: Walk through the process step-by-step—ideally with a colleague or stakeholder—to validate the flow. Ask: “Can someone unfamiliar with this process follow it to completion without getting stuck?”
9. No Version Control or Documentation
Problem: Teams often update processes without updating the flow chart, leading to outdated or misleading diagrams.
Fix: Maintain version control and date your flow charts. Store them in a shared, easily accessible platform (like Notion, Confluence, or a shared drive) and assign an owner for updates.
10. Irrelevant flowcharts
Problem: Flow charts without context may not communicate the why or provide enough background for users to fully understand the process.
Fix: Accompany flow charts with brief descriptions, SOPs, or process narratives that explain business rules, goals, or exceptions.