Flowcharts are fantastic tools for visualizing business processes, streamlining complex workflows, and enhancing team collaboration. Whether you’re outlining a standard operating procedure, detailing a project workflow, or creating a decision tree, a well-designed flowchart conveys ideas clearly and effectively. However, a cluttered diagram can do more harm than good. To create flowcharts that drive clarity and action, follow these 10 essential rules:
1. Start with a Clear Objective
Before opening your flowchart tool, define the purpose of your chart. Are you illustrating a business process? Mapping out a user journey? Documenting a decision path? Having a clear objective will help you stay focused and determine what information is relevant.
Pro tip: Use a one-sentence goal statement like: “This flowchart shows the steps for onboarding a new employee.”
2. Know Your Audience
Design your flowchart based on who will use it. An executive might need a high-level overview, while an operations team may require detailed process steps. The level of detail and technical language should match your audience’s familiarity with the process.
3. Use Standard Symbols
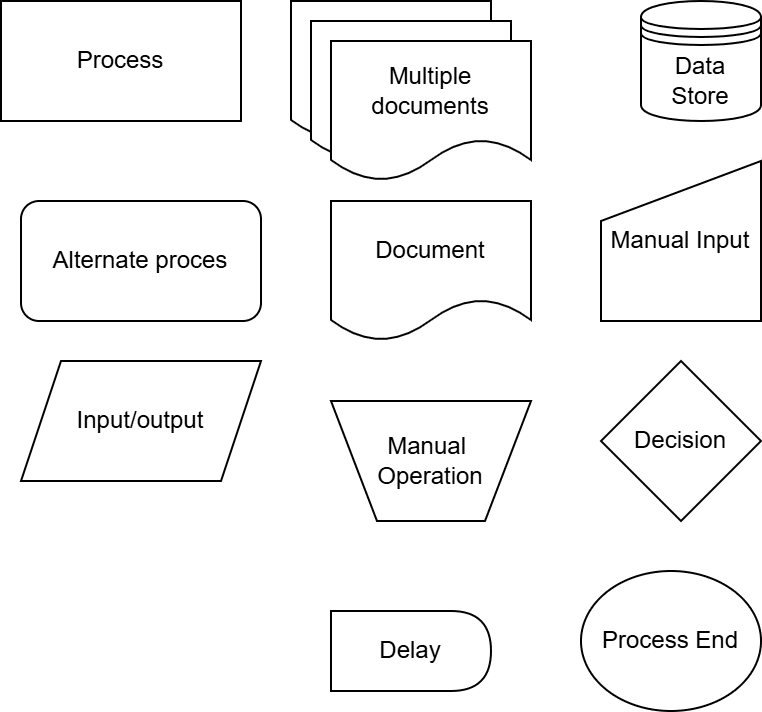
Stick to universally recognized flowchart symbols to make your chart intuitive. Using standard symbols keeps your flowchart readable for anyone familiar with process mapping. Let’s review a few of the standard symbols.
Terminal / Start-End Symbol
– Shape: Oval or Pill shape
– Purpose: Indicates the start or end of a process.
Process Symbol
– Shape: Rectangle
– Purpose: Represents a process, operation, or action step.
Decision Symbol
– Shape: Diamond
– Purpose: Represents a decision point with multiple possible outcomes.
Input/Output Symbol (Data Symbol)
– Shape: Parallelogram
– Purpose: Represents data input into or output from a process.
Document Symbol
– Shape: Rectangle with a wavy bottom edge
– Purpose: Indicates a document or report.
Multiple Documents Symbol
– Shape: Overlapping document shapes
– Purpose: Represents multiple documents generated or received.
Manual Input Symbol
– Shape: Trapezoid (open on the left side)
– Purpose: Indicates data manually input by a user.
Manual Operation Symbol
– Shape: Trapezoid (flat top and bottom, slanted right edge)
– Purpose: A step that is manually performed by a person (not automated).
Stored Data / Data Storage Symbol
– Shape: Cylinder
– Purpose: Represents data stored in a database or system.
Internal Storage Symbol
– Shape: Rectangle with a concave side (like a drum)
– Purpose: Indicates information stored within the system (RAM or variable).
Tools That Support These Symbols
Most modern flowchart tools support these symbols by default, including:
- Lucidchart
- Microsoft Visio
- Miro
- Draw.io
- Creately
- Whimsical
- SmartDraw
4. Keep It Simple and Linear (When Possible)
Complex processes can sometimes be unavoidable, but simplicity is key. Try to keep the flow from top to bottom or left to right. Avoid crisscrossing lines and backtracking arrows—they make charts harder to follow. If a process is too complex for one chart, break it into multiple smaller flowcharts.
5. Maintain Consistent Formatting
Use uniform shapes, fonts, spacing, and colors. Consistency reduces visual clutter and makes it easier to navigate the chart. For example:
– Align shapes neatly
– Use the same font size throughout
– Color-code categories if helpful—but don’t overdo it
6. Limit the Use of Text
Flowcharts should visually guide the reader. Use concise, action-oriented phrases like “Submit application” or “Review report.” Avoid full sentences or paragraphs inside shapes. If more explanation is needed, link to or reference additional documentation outside the flowchart.
7. Use Directional Arrows Clearly
Arrows are the backbone of your chart—they show the direction of process flow. Make sure each shape has a clear entry and exit point. Use straight arrows and try to avoid too many diagonal lines or loops. Crossing arrows is a common problem, especially in complex charts. They make the diagram harder to read and can lead to misinterpretation.
– If crossing is unavoidable, use jump-overs or bridging lines to indicate intentional crossings (many tools do this automatically).
Ensure arrows connect from the correct output point to the proper input point.
For instance:
– An arrow leaving a decision diamond should always connect to the next step, not back to the diamond itself.
– Avoid arrows that “float” between shapes or seem to point ambiguously at the edge.
In advanced flowcharts, you can use color-coded arrows to show different paths, especially for exceptions, escalations, or alternative flows. Be sure to include a legend. Use this approach sparingly—too many colors can overwhelm the chart.
8. Label Decisions and Branches Clearly
When using a decision diamond, always include clearly labeled paths such as “Yes” or “No.” This ensures the reader understands what each branch represents and what action follows.
9. Review for Logic and Accuracy
Test your flowchart like a process map: follow each step from start to finish. Does every path make logical sense? Are there any dead ends? Ask others to review it to catch gaps or inconsistencies you might have missed.
10. Include a Title and Legend (If Needed)
Give your flowchart a clear title so users immediately understand its purpose. If you’re using colors or non-standard shapes, add a simple legend to explain what they mean. This adds clarity, especially for larger charts.